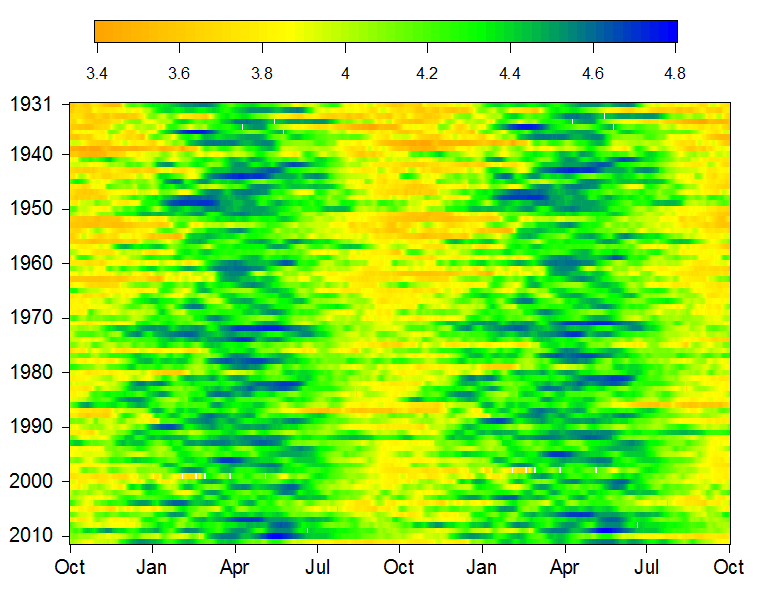
Log10 of Mississippi River streamflow in meters3/second measured daily at Vicksburg MS.
The graphic shows:
Each row represents 2 years of data but is one year later than the one above it; this redundancy avoids arbitrary temporal divisions and allows us to see the 'dry' inter-year period as a whole. The USGS water year is October to September. Data are from US Geological Survey and US Army Corps of Engineers, although the current site does not show data back to 1931.